How to Visualize Colony Costs
Colony Costs can be visualized overall or broken down by a few parameters.
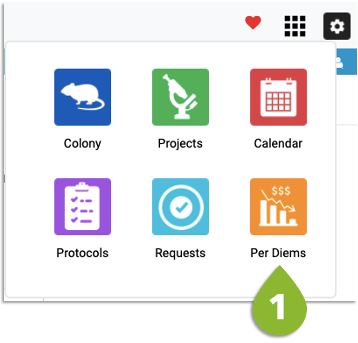
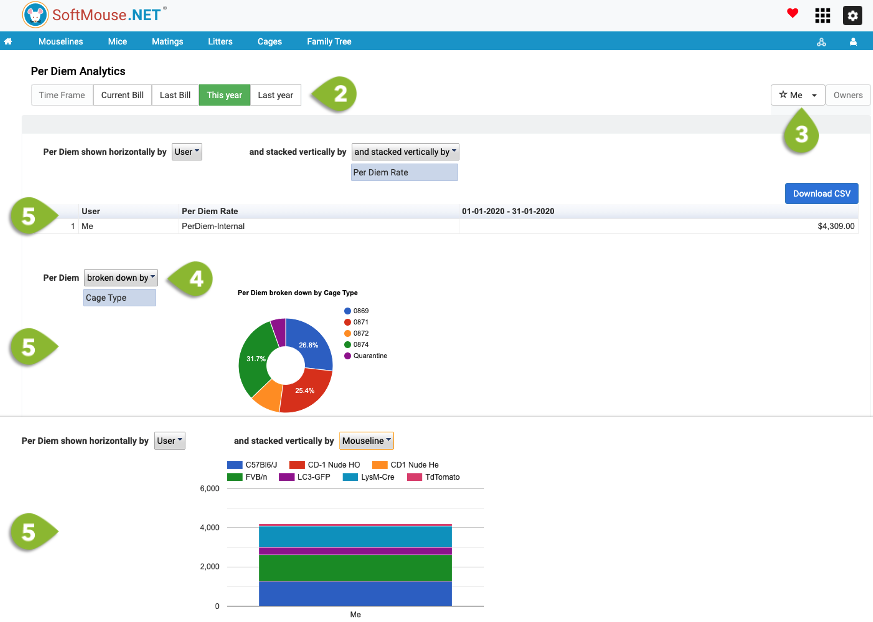
- Go to the Per Diems Module -- Colony Costs for the current billing period and the logged in user will display by default
- Click on the various Time Frame buttons to visualize colony costs by period, i.e. Current Bill, Last Bill, This Year, Last Year
- Click on the Owners drop down list to select one or multiple data owners you want to visualize Colony Costs for
- Select what parameter you want to use to break down your Colony Costs: Per Diem Rate, Protocol, Mouseline, Cage Type
- Use the table format, pie chart or bar chart to visualize your Colony Costs in your preferred way
If you have any further questions, please contact us with your inquiry.